
Addressing Soil Contamination Under River Road
The components of the Perimeter Air Monitoring Plan during the work to address contamination under River Road consists of the following:
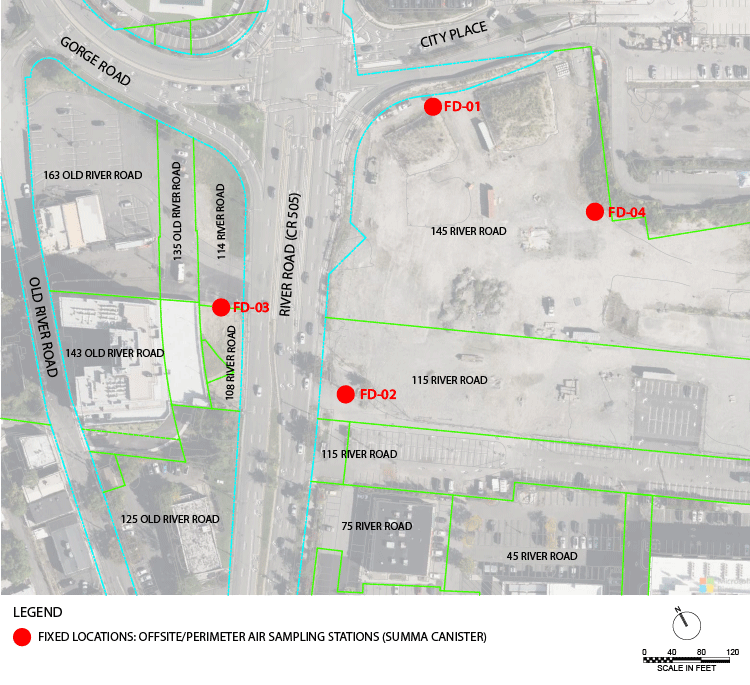
- "Real-time" Monitoring - Daily "real-time" monitoring for dust and total volatile organic compounds (VOCs) using four fixed location and three mobile air monitors during work shifts. Results can be found on the air monitoring map below.
- Continuous (24-hour) meteorological monitoring to assess wind directions and wind speeds over the course of the project.
- Meteorological monitoring data will be used in combination with real-time monitoring to assess the potential for the dispersion of emissions from site operations.
- Prior to the disturbance of soil at the site, air monitoring will be conducted at the perimeter to establish baseline air quality.
- The real-time monitoring system is intended to provide early notification of potential emissions of contaminants in the soil. Alert and Action Levels are approved by EPA.
- The Alert Level, the lower of the two, alerts the team that measurements in question have increased. The Action Level dictates that, if the level is sustained, action must be taken to determine the cause of the exceedance and to implement corrective measures such as application of water and/or foam, as well as reduction in the intensity of vapor- and/or particulate-generating remedial activities.
- When an exceedance is under the control of the project team, corrective action shall be taken, and a record shall be made. When it is determined that the exceedance is due to offsite emissions, a record shall be made, and the Construction Manager shall be notified in a timely manner.
- If visible dust caused by the work is observed crossing the site perimeter, intrusive work will be immediately suspended until dust control measures can eliminate the occurrence of visible dust.
- Field crews will be trained to stay alert for odors, and to use foam suppression preemptively.
Air Monitoring Map
"Real Time" Perimeter Data - Data for total VOCs and dust is provided in this interactive map.
To view the data collected, select a date from the drop-down list and click "Change" (dates not shown in the list have no data available). Then, move your cursor over a fixed monitor icon to view the data. Mobile monitor data and weather data can be accessed using the links below the map graphic.
| Weather Data | |
|---|---|
|
View wind direction & speed gathered on August 09, 2024 from Monitor FD-01 View wind direction & speed gathered on August 09, 2024 from Weather Monitor |
| Mobile Monitor Data
Locations of Mobile Devices (MD) are adjusted daily based on field operations, wind direction, and sensitive receptors. |
|
|---|---|