
Health and Safety
Monitoring Air Quality
To protect public health and the safety of workers onsite and the community where people live, work, and shop, Honeywell, under the oversight of the EPA, has implemented an extensive air monitoring program. The Health and Safety Plans and the Perimeter Air Quality Monitoring Plans, which were reviewed and approved by EPA, are key parts of the cleanup. These documents are available at the Edgewater Public Library, 49 Hudson Ave., Edgewater, NJ 07020.
Please access: Addressing Soil Contamination Under River Road for air monitoring associated with this project.
Below is information related to air monitoring on the main Quanta site conducted 2017- 2021.
With the completion of soil remediation activities on the main Quanta site, Honeywell, with EPA approval, suspended air monitoring at offsite residential properties. Limited "real time" monitoring continued onsite for dust and total volatile organic compounds during final grading and demobilization activities.
Components of the air monitoring program included:
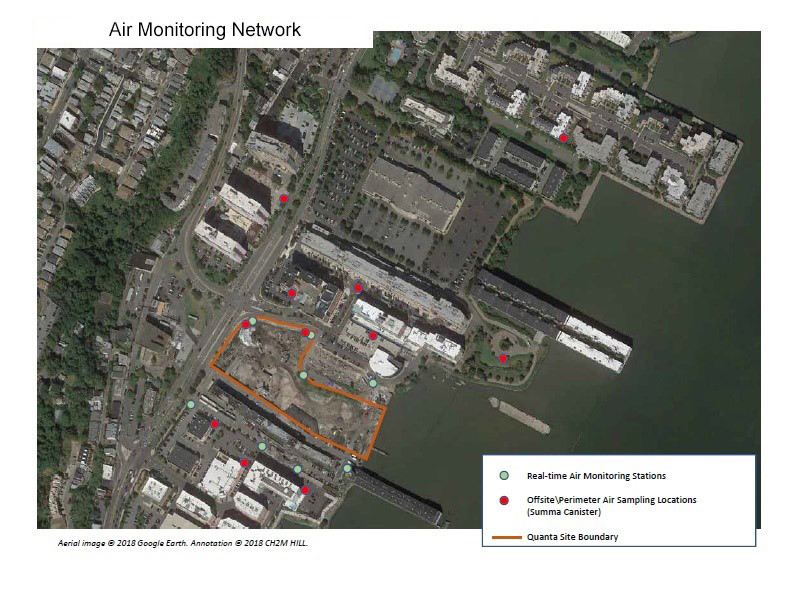
- "Real-time" Site Perimeter Monitoring - Daily "real-time" monitoring for dust and total volatile organic compounds (VOCs) was conducted during soil remediation using fixed and mobile air monitors around the perimeter of the site. Results can be found on the air monitoring map below. Data collected and analyzed for individual site contaminants at the perimeter are found here: Phase 1 (no tents), demolition, and Phase 2 (most work under the tents).
- Offsite Air Monitoring - To protect public health where people live, work, and shop, air sampling of site contaminants was conducted in the surrounding community as well as at the site perimeter fence line. Data was collected and analyzed for individual site contaminants. Samples were collected daily for 24-hour periods from three locations in City Place and iPark, and one location in The Promenade, The Metropolitan, and Independence Harbor.
- Daily air sample results were used to calculate a running project average. The running average was updated weekly as results became available. That average was then compared with the Risk Screening Level that EPA set for individual chemicals.
Click below to see a graph of the running averages of naphthalene concentrations compared to the risk screening levels.
- Risk Screening Levels are based on conservative assumptions and assume “chronic” exposure - a resident being exposed to a chemical (e.g., through breathing it) for 24 hours per day, 350 days per year for 7 years (10% of an average lifespan of 70 years). For naphthalene, people would need to be breathing it at levels above the Risk Screening Level continuously for 7 years to be at an unacceptable risk level for adverse respiratory effects.
- Because the Risk Screening Level is based on long-term exposure to a chemical, it should be compared against the running average of that chemical during the project, rather than individual daily results. Individual daily results are not an indicator of long-term exposure.
- The graphs accessed above show the running averages of naphthalene concentrations over the life of the project compared to the project-specific Risk Screening Level for naphthalene, developed in consultation with EPA. Naphthalene is the only contaminant that historically was been observed above the Risk Screening Level; therefore, similar graphs were not developed for other chemicals.
- More about Risk Screening Levels can be found here.
- Daily air sample results were used to calculate a running project average. The running average was updated weekly as results became available. That average was then compared with the Risk Screening Level that EPA set for individual chemicals.
Air Monitoring Maps
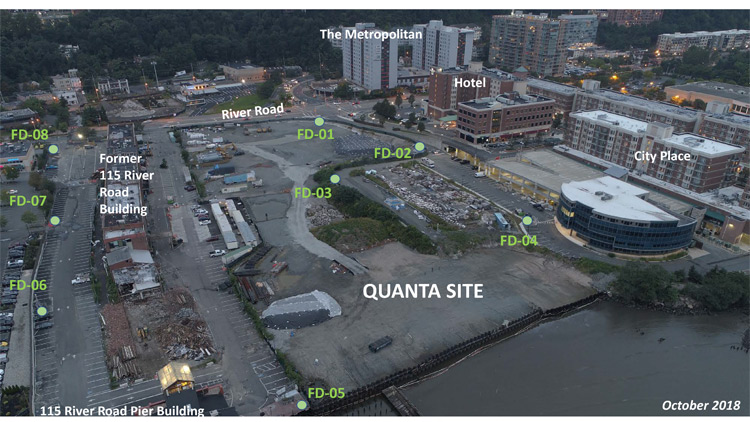
"Real Time" Perimeter Data - Data for total VOCs and dust is provided in this interactive map.
To view the data collected, select a date from the drop-down list and click "Change" (dates not shown in the list have no data available). Then, move your cursor over a monitor icon to view the data. Click "View wind direction & speed" to see a graph of the wind conditions for the selected date.
Monitor FD-03
- No data available for this day
Monitor FD-04
- No data available for this day
Monitor FD-01
- No data available for this day
Monitor FD-02
- No data available for this day
Monitor FD-07
- No data available for this day
Monitor FD-08
- No data available for this day
Monitor FD-05
- No data available for this day
Monitor FD-06
- No data available for this day
| Weather Data | |
|---|---|
|
No weather station data available for the selected date. |
| Mobile Unit Data
Locations of Mobile Devices (MD) are adjusted daily based on field operations, wind direction, and sensitive receptors. |
|
|---|---|